
Housing starts across Canada fell to a seasonally adjusted annual pace of 229,046 units in August 2026, while building permits declined 2.3% compared to the same month a year earlier. For buyers and sellers in Toronto and the GTA, these two measures offer a window into how much new supply is actually being built right now and what might arrive over the next year or two.
The gap between permits and starts has narrowed, and both are trending lower. That matters because permits represent intentions to build, while starts measure shovels in the ground. When both fall together, the pipeline of future inventory shrinks.
Key Takeaways
- Housing starts ran at an annual pace of 229,046 units in August 2026, down 6.2% from August 2025 and nearly flat from July 2026.
- Building permits totalled 7,209,514 thousand dollars in July 2026, down 2.3% year-over-year and 8.9% from June 2026.
- New home prices measured by the index fell to 120.4 in August 2026, down 2.0% from a year earlier, as builders pulled back.
- The narrowing gap between permits and starts suggests fewer projects are moving from approval to construction.
- Buyers face a slower pace of new supply arriving in 2027, while sellers in the resale market may see less competition from new builds.
Housing Starts Remain Below Recent Peaks
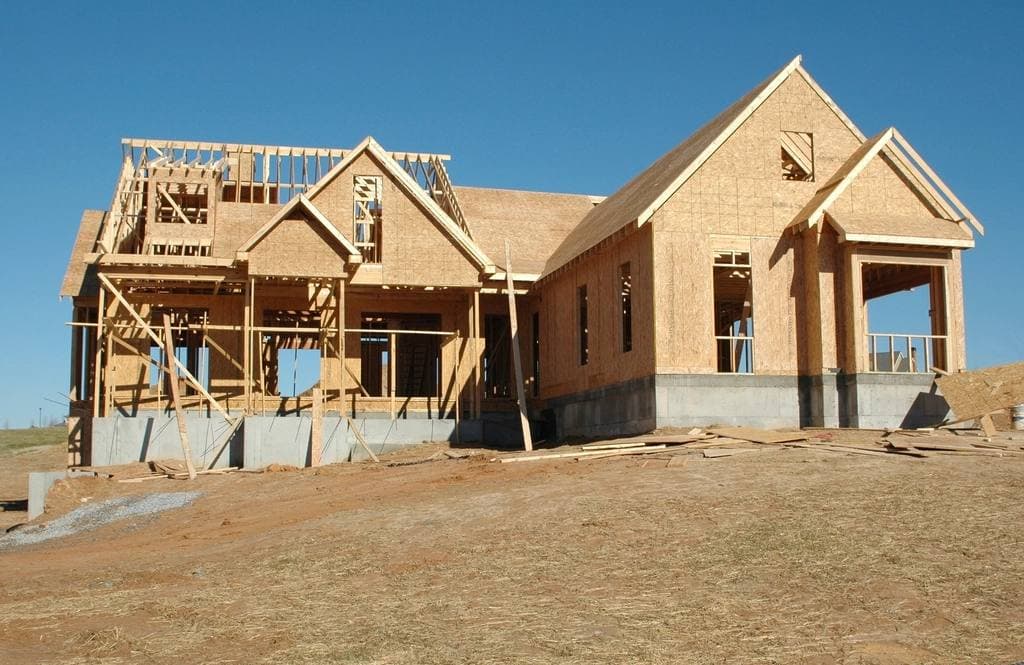
Housing starts measure the number of new homes where construction has actually begun, expressed as an annualized rate after seasonal adjustment. In August 2026, that pace sat at 229,046 units nationwide, down from 229,360 in July and 244,294 a year earlier.
The year-over-year decline of 6.2% reflects a construction industry that has pulled back from the higher activity seen in mid-2025. Starts peaked at 293,877 in July 2025 and have since settled into a lower range. The August figure represents the slowest pace since January 2026.
For the GTA, this slowdown means fewer new homes breaking ground. Developers cite higher financing costs, longer approval timelines, and softer pre-sale absorption as reasons for the caution. When starts fall, the inventory of brand-new homes available twelve to eighteen months from now shrinks accordingly.
Building Permits Signal Future Activity
Building permits capture the dollar value of construction that municipalities have approved but not yet started. In July 2026, permits totalled 7,209,514 thousand dollars, down 2.3% from July 2025 and 8.9% from the prior month.
Permits typically lead starts by several months. A developer secures a permit, arranges financing, and then begins construction. The recent decline in permit values suggests that the pipeline of projects waiting to start has thinned. Fewer approvals today mean fewer starts in the months ahead, and fewer completions in 2027 and early 2028.
The month-to-month drop of 8.9% from June to July 2026 is notable. While building activity can be lumpy, the downward trend over the past year points to a more cautious development sector across the country, including in the GTA.
New Home Prices Continue to Ease
The new housing price index, which tracks what builders charge for newly constructed homes, stood at 120.4 in August 2026. That figure is down 2.0% from 122.9 in August 2025 and has declined steadily since peaking above 123 in mid-2025.
This index does not measure resale home prices. It reflects the pricing power of builders in the new construction market. When the index falls, it usually means builders are offering incentives, holding prices flat, or cutting list prices to move inventory. The year-over-year decline suggests demand for new homes has softened enough that builders cannot raise prices the way they did in prior years.
For buyers comparing new builds to resale homes in Toronto and the GTA, the narrowing price premium on new construction can make newly built homes more competitive, especially when builders include upgrades or cover closing costs.
What the Gap Between Permits and Starts Tells Us
When building permits grow faster than housing starts, it signals a healthy pipeline: approvals are accumulating, and developers have projects ready to launch. When permits fall while starts also decline, the pipeline is shrinking at both ends.
In the current cycle, permits dropped 2.3% year-over-year while starts fell 6.2%. The larger decline in starts suggests that some approved projects are not moving forward, either because financing fell through, pre-sales were weak, or builders decided to wait for better market conditions.
This dynamic has direct implications for supply. Fewer starts today mean fewer completed homes in twelve to twenty-four months. In a market like the GTA, where demand remains strong relative to supply, a slower pace of completions can support resale prices by limiting the number of new listings that compete with existing homes.
What This Means for Buyers
Buyers shopping for new construction in the GTA should expect a smaller selection of projects launching over the next year. Builders are proceeding cautiously, and the pace of new inventory hitting the market has slowed.
That said, the 2.0% year-over-year decline in the new housing price index suggests that builders are willing to negotiate. Incentives such as capped development charges, included upgrades, or flexible deposit structures are more common when builders face softer demand.
For those considering resale homes, the slower pace of new supply means less competition from buyers who might otherwise choose a new build. Inventory in the resale market remains the primary source of available homes, and understanding how to read a market update can help you time your purchase.
If you are weighing your options, a free home valuation can clarify what resale homes in your target neighbourhood are worth relative to new construction.
What This Means for Sellers
Sellers in the resale market benefit when new construction slows. Fewer new homes coming to market means less competition for your listing, especially if you are selling a detached home or townhouse in a neighbourhood where new builds are scarce.
The decline in housing starts also suggests that the wave of new supply some sellers feared would flood the market is not materializing at the pace once expected. If you have been waiting for the right time to list, understanding the supply dynamics can help you decide whether to move now or wait.
Keep in mind that buyers comparing your home to new construction will weigh factors like location, lot size, and the ability to move in immediately. Highlighting these advantages in your listing can set your property apart.
Renanza's agents understand the Toronto and GTA market and can position your home to compete effectively, whether against resale inventory or new builds.
Outlook: A Slower Supply Pipeline Through 2027
The combination of falling permits and declining starts points to a slower pace of new supply arriving in the GTA through 2027. Builders are unlikely to ramp up activity until they see stronger pre-sale demand or lower financing costs.
For buyers, that means the inventory of new homes will remain constrained, and competition for well-located resale properties may stay firm. For sellers, it means less pressure from new construction and a market where existing homes continue to play the dominant role.
The trajectory of interest rates, immigration policy, and municipal approval timelines will all influence how quickly the supply pipeline refills. For now, the data shows a construction sector that has downshifted and is waiting for clearer signals before accelerating again.
If you are planning a move in the GTA, whether buying or selling, Renanza's team can help you navigate the current supply dynamics and make informed decisions. Explore residential listings in Toronto and the GTA or reach out for a consultation.
Sources
- Statistics Canada, New housing price index, monthly, August 2026, https://www150.statcan.gc.ca/t1/tbl1/en/tv.action?pid=1810020501
- Statistics Canada, Building permits by type of structure, July 2026, https://www150.statcan.gc.ca/t1/tbl1/en/tv.action?pid=3410029201
- Canada Mortgage and Housing Corporation (via Statistics Canada), Housing starts, Canada and provinces, August 2026, https://www150.statcan.gc.ca/t1/tbl1/en/tv.action?pid=3410015801
Data last checked: 2026-08-31